
OTel Collector
- KubeWeekly#391
- Intro
Content
The OpenTelemetry Collector is designed to offload observability processing to a separate service, distancing it from the applications that generate the observability data. By doing so, applications can remain streamlined, focusing solely on their core functionality, while the advanced signal processing logic is centralized and shared across all services in the system.
Today, we will explore how such services can be implemented.
OTel Collector
In the previous article about the trace, metrics, log pipelines in the OTel SDK part, we briefly touched on exporters at the end of the pipelines. While OpenTelemetry SDK does support a limited number of exporters like OTel-compatible backends, Jeager or Zipkin (for traces), and Prometheus (for metrics), it’s recommended to send all signals out of your services as soon as possible to do all needed signal processing in the OTel Collector.
The OpenTelemetry Collector acts as an additional layer of indirection that protects your business services from changes in observability backends since your services are exposed only to the collector.
The Collector makes life easier for your business services by taking over the heavy lifting of collecting observability data. This includes batching, sampling, cleaning, and finally, exporting the data to various backends. By offloading these tasks to a vendor-neutral service, your code stays cleaner and more focused.
Think of it like using a database, a queue or an API gateway. Each of these offloads some responsibilities from your services making them simpler in the end. Just like in those cases, deploying the collector might add complexity to your system since there’s one more piece to maintain.
Architecture
The high-level architecture of the OTel Collector is somewhat similar to the SDK trace design. The collector consists of three uniform signal processing pipelines per each signal type.

Each pipeline, in turn, is made up of three stages:
- Receiving. The receiver components accept the signals from external data sources.
- Processing. The processor components can do all sorts of preprocessing like batching, filtering, attribute reduction, etc.
- Exporting. The exporter components fan out processed data into observability backends.
There are also connector components that can connect the end of one pipeline with the beginning of another. This allows the use of pipeline output as a source of signal for another pipeline.
It’s cool to note that all of these pipelines can be dynamically put together based on the Collector’s config.
Configuration
The OTel Collector’s config is a YAML file and its structure is tied to the service architecture to make it easier to understand it and reason about.
There are sections like receivers, processors, exporters and a service that connects them all together allowing to define service.pipelines:
receivers:
  otlp:
    protocols:
      grpc:
        endpoint: localhost:4317

processors:
    memory_limiter:
    batch:

exporters:
    jaeger:
    datadog:

service:
  pipelines:
    traces:  # a default trace pipeline
      receivers: [otlp]
      processors: [memory_limiter, batch]
      exporters: [jaeger]
    traces/datadog:  # another trace pipeline
      receivers: [otlp]
      processors: [batch]
exporters: [datadog]receivers:
otlp:
protocols:
grpc:
endpoint: localhost:4317
processors:
memory_limiter:
batch:
exporters:
jaeger:
datadog:
service:
pipelines:
traces: # a default trace pipeline
receivers: [otlp]
processors: [memory_limiter, batch]
exporters: [jaeger]
traces/datadog: # another trace pipeline
receivers: [otlp]
processors: [batch]
exporters: [datadog]Each component type is possible to define separately outside of the pipeline definition to be able to be reused in multiple pipelines without copy-pasting its definitions.
Components have IDs in a special format type/name like traces/datadog, batch, or otlp in the sample config above. The name can be empty which is nice if you don’t have many instances of the same component type.
The config itself can be loaded from multiple sources:
- Environment variable
- YAML file
- YAML string
- External HTTP(S) URL
All sources are merged together to get an effective configuration. Along the way, the OTel Collector expands environment variables in the config content like $ENV_VAR.
This allows you to keep sensitive information outside of the general config that you may take under git version control.
Pipelines
After loading and merging the config, the collector gets to work on building the defined pipelines and their related components.
Given that all service layouts are fully dynamic, we don’t know the order in which to build, start, and stop the pipeline’s components ahead of time. To address that, the collector represents the pipeline configuration as a directed acyclic graph (DAG). It then performs topological sorting on the graph to get the right order, considering dependencies between the pipeline components.

In addition to nodes corresponding to consumers we’ve already seen (e.g. receivers, processors, exporters), each pipeline graph also includes two more “virtual” node types:
- The
Capabilitynode is the first data consumer in every pipeline and effectively represents whether a pipeline has any processors that would mutate incoming observability signals. Not having that bit of context, we would have to assume that all pipelines mutate their data. That would prevent us from having some of the low level memory usage optimizations that theFanOutnode does. - The
FanOutnode performs “smart routing” of incoming signal data. It’s typically used after receivers and before exporting state. It sends copies of original data to all consumers (e.g. the first processor in a pipeline or an exporter) that mutates data and then uses the original copy to send it to all consumers that don’t change the incoming structure. This saves us from unneeded memory allocations and eliminates issues related to concurrent modifications of the same data from multiple consumers. For example, a few exporters can process and export the same data at different paces affecting each other’s work.
Receivers
As the name suggests, receivers accept observability signals and trigger the processing pipeline.
The OTel Collector provides HTTP- and gRPC-based receivers out of the box. Since the OTel protocol uses a push model, the OTel receiver simply starts a regular HTTP or gRPC server and waits for instrumented services to connect.
In addition to the OTel format, the collector could be configured to accept signals in Jaeger, Zipkin, AWS X-Ray, StatsD, Prometheus protocols.
Moreover, signals can be received from message queues like Apache Kafka, GCP PubSub, Azure EventHub, etc.
Not all systems natively speak the OTel protocol, so some receivers can extract useful statistics from various systems and convert them into OTel signals. This includes Redis, MongoDB, RabbitMQ, NGINX, PostgreSQL, and many others.
Metrics Scraping
Specifically for metrics, in addition to the OpenTelemetry push-based metrics collection, the collector supports Prometheus-like data scraping (e.g. the pull model).
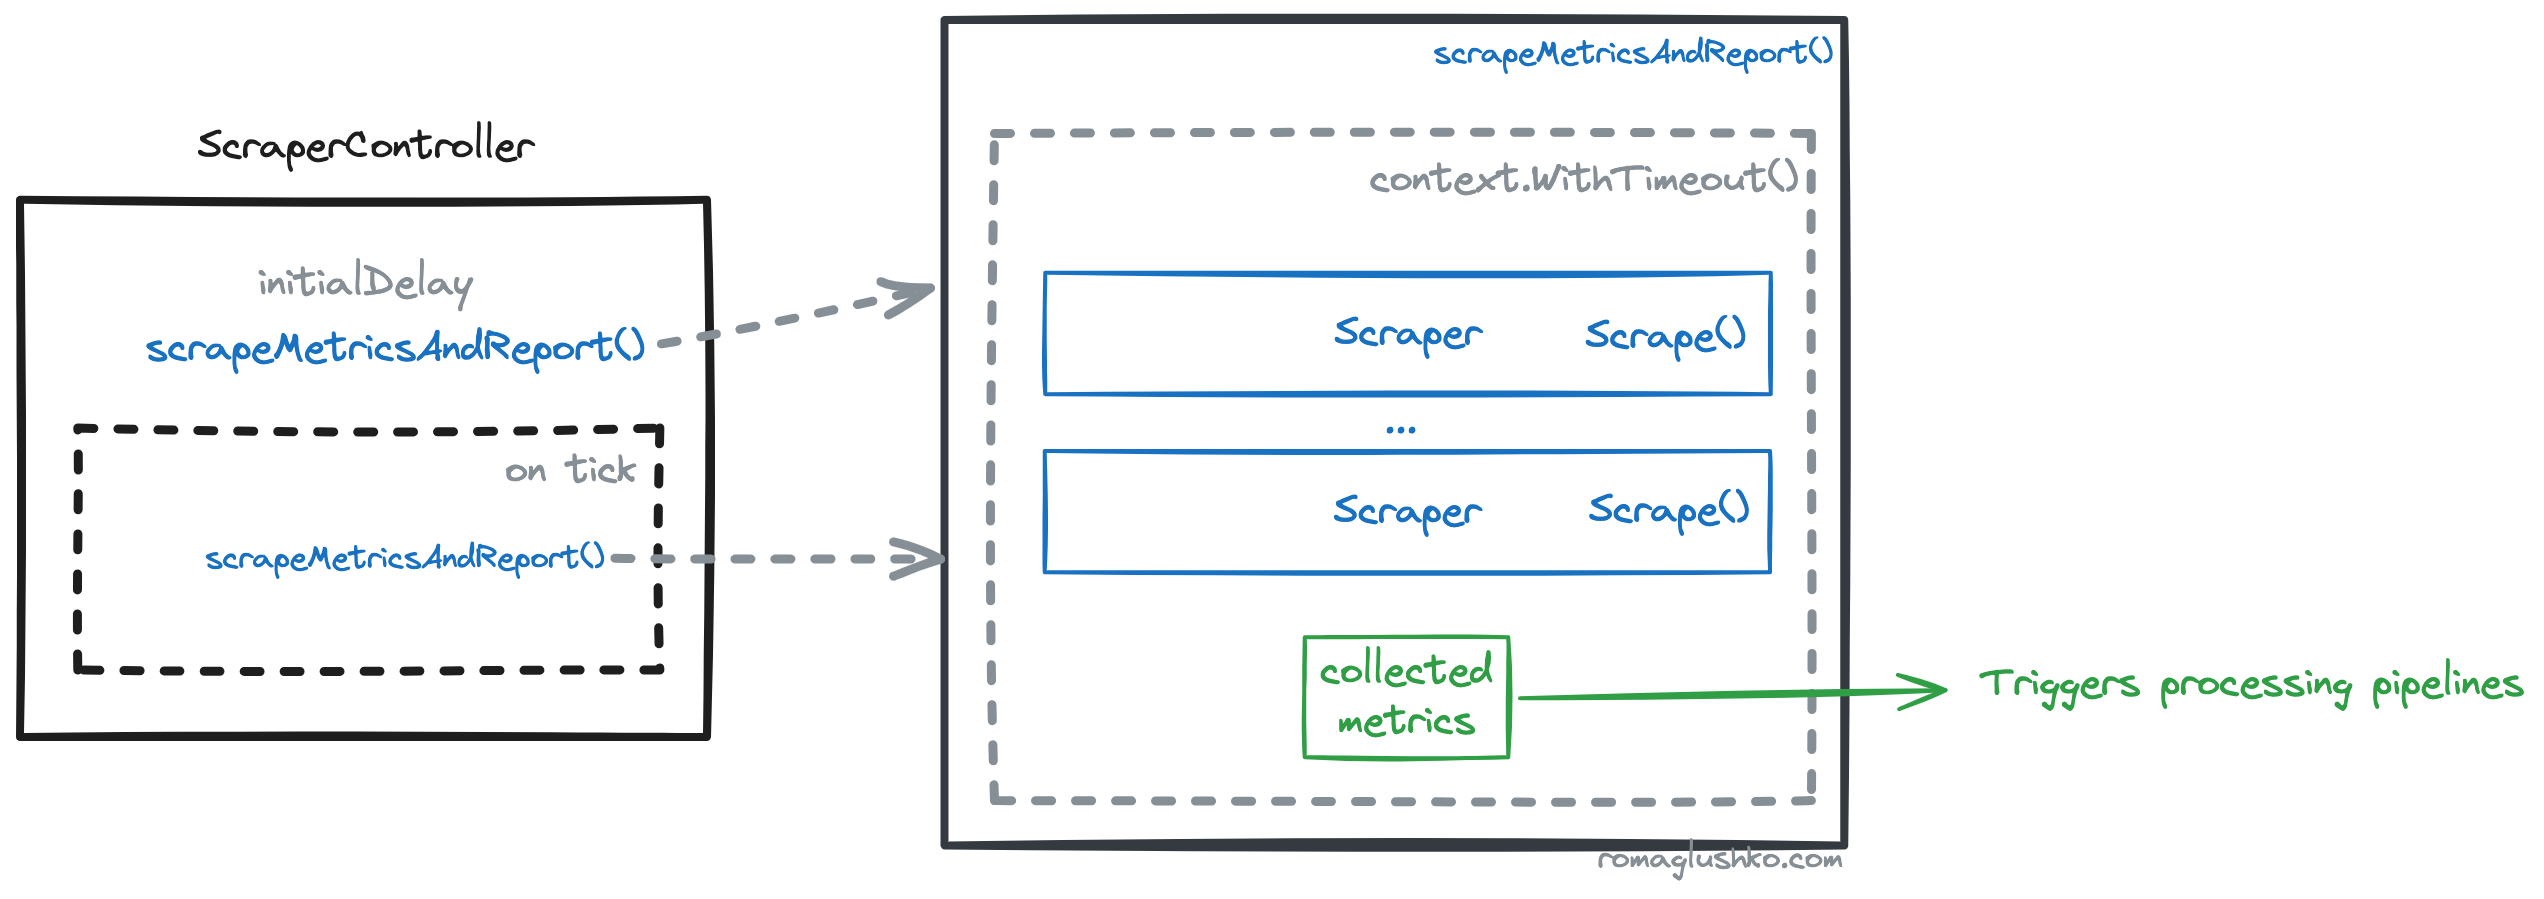
The collector scraping architecture consists of ScraperController which manages a set of configured scrapers.
The ScraperController maintains a ticker one for all scrapers that initializes the beginning of scraping.
All scrapers collect and return metrics (as OTel metric data structs) that in turn get batched.
The batch is used to start all processing pipelines scrappers connected to.
The whole scraping process can be limited in time via context’s timeout.
Processors
Processors are the most “logic-rich” part of pipelines that can do all sorts of modifications on the incoming signal batches, such as:
- sampling or filtering data,
- batching,
- rejecting or retrying batches,
- so on.
A set of processors in a pipeline forms a processing chain, so the first processor gets data earlier than others, may modify it, and send it further to the second processor, and so on. This way, the order in which processors are defined in a pipeline is super important. Effectively, this means that filtering and sampling should be defined closer to the beginning of pipelines while something like batching typically goes in the middle or the end of pipelines.
Memory Limiter
One of the default processors that comes with the OTel collector is the memory limiter processor. The collector handles a ton of data, and the amount of data and resources it can use vary a lot depending on the system generating the data. Because of this, the collector is a memory-bound service that can easily run out-of-memory (OOM) if it’s not setup correctly. The memory limiter is a clever engineering solution to help prevent these issues.
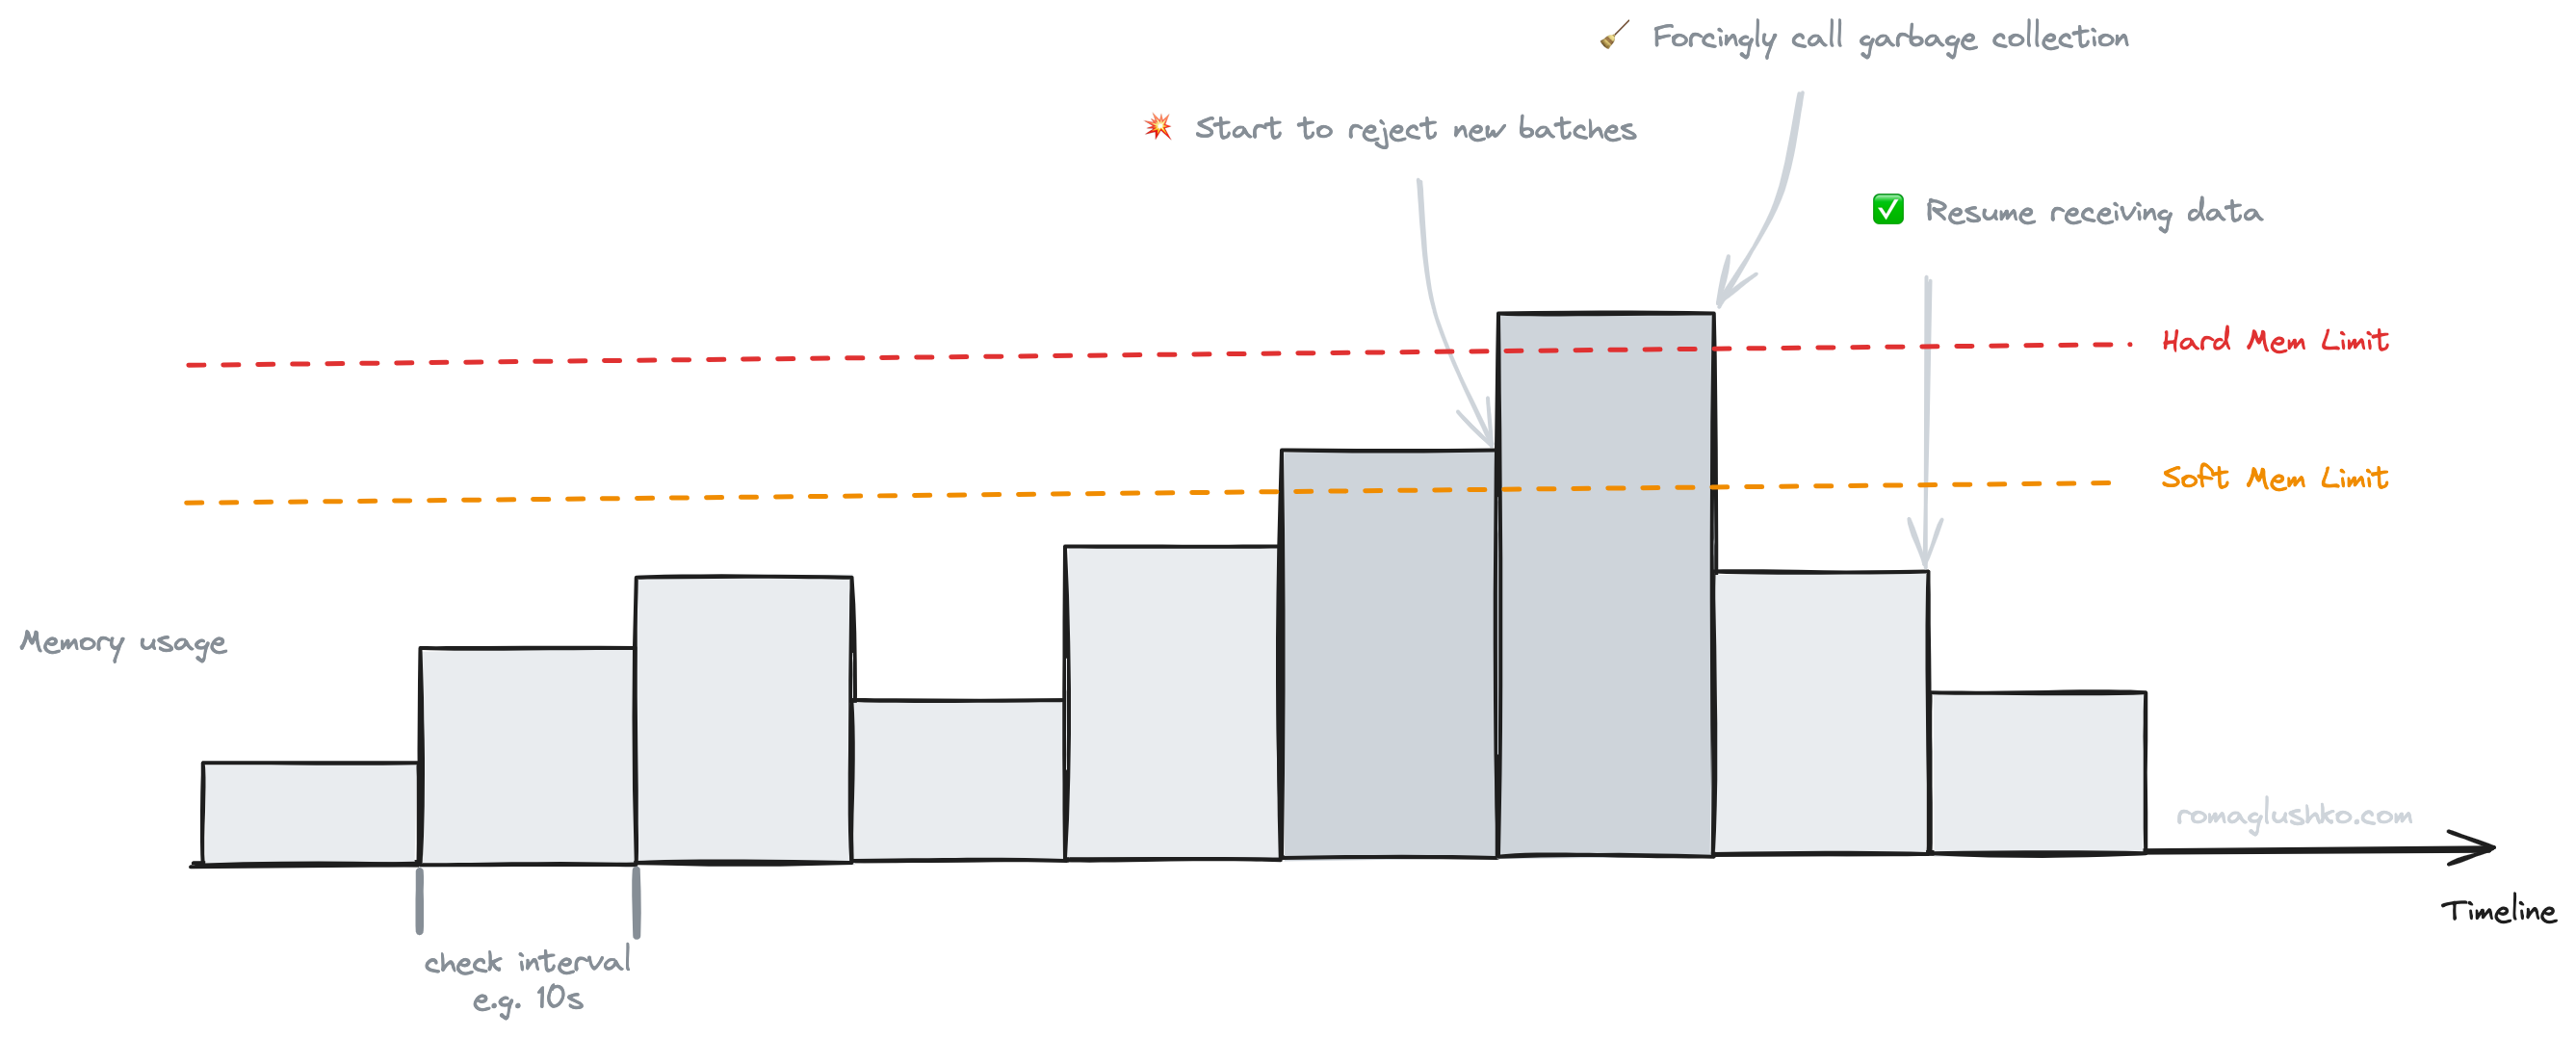
The memory limiter checks service memory usage periodically and sees if the usage goes above any of the defined limits:
- The soft memory usage limit (or the spike limit). If memory usage goes beyond the soft limit, the collector starts to shed load and reject all incoming data.
- The hard memory usage limit. If memory usage goes above the hard limit, the collector immediately calls Golang runtime.GC() to hopefully reclaim enough memory to start accepting data again. Garbage collection is not a cheap operation, so additionally make sure it’s not done more frequently than once in 10 seconds.
The memory limiter can be seen as a way to add back pressure to the collector, so it’s harder to overload the service. Although this requires receivers and signal producers to handle data rejections gracefully which normally boils down to retries with backoff.
Batch Processor
The batch processor looks a lot like SpanProcessor from OTel SDK but it can process all three types of signals. Similarly, the collector’s batching is bounded by batch size and timeout.
Unlike SpanProcessor, the batch processor supports sharding data by client metadata enabling OTel collector to process data in a multi-tenant way.

Each shard will hold information for a specific tenant which makes it easier to export to store separately.
For example, Grafana’s LGTM stack supports multi-tenant data storage and processing.
All you gotta do is to pass the X-Scope-OrgID along with your requests.
Exporters
Exporters handle batches prepared by processors. Internally, these exporters are structured as pipelines, too, each equipped with a series of sender components designed to ensure the reliable export of signal batches:
- Queue sender enqueues incoming batches to be sent further according to a specified parallelism (e.g. determined by the number of queue consumers) to the next stages of the sending pipeline.
- Retry sender uses exponential retry with backoff to try sending batches in case of errors. Interestingly, the OTel Collector doesn’t cap the maximum number of retries but rather limits the total time the batch was trying to be exported.
- Timeout sender limits the time the collector waits for successful signal accepting on the observability backend side.
- Pusher stage. The final stage of the sending pipeline, where either an HTTP or gRPC request is made to the observability backend.

Export Queues
The Queue Sender can be configured to use:
- Simple bounded in-memory queue. It rejects new batches as long as its capacity is full. As a data structure for the queue, OTel uses a Go’s channel with a predefined capacity.
- Or a persistent queue that stores items on disk.
Let’s dive a bit into how data persisting is actually implemented.
The storage used to persist queue items is provided via special extension type. The storage extension interface resembles a simple key-value database interface:
- it supports
get(),set(),delete()value by key - additionally, it allows to
batch()these operations which is a form of transactions
Using that interface, the OTel Collector organizes processing this way:
- Each signal batch is stored as a value under an incremental key.
- The collector persists
writeIndexandreadIndexto know what is the next batch index to use or to dispatch and tries to export correspondingly. The dispatched items are persisted too. - If a batch has been successfully exported, it will be removed from the storage.
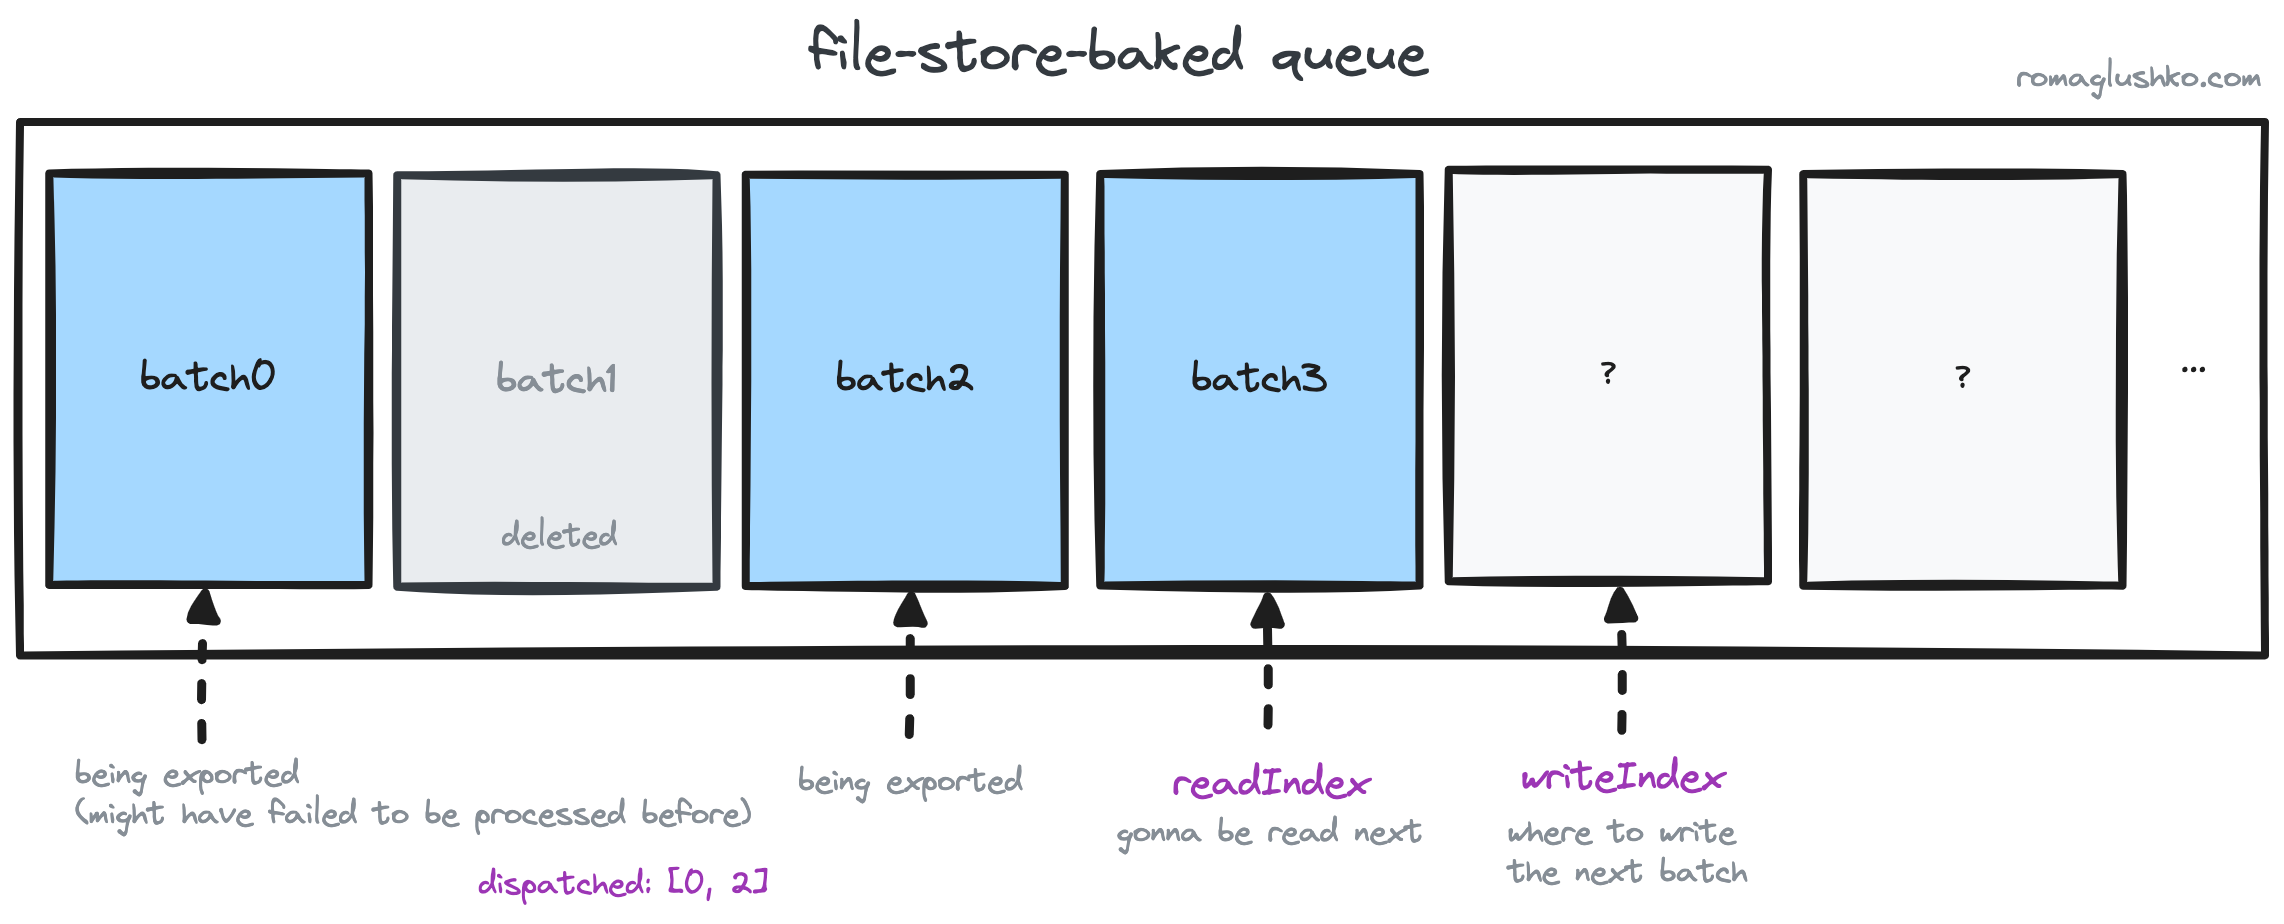
As of now, the OTel Collector provides storage implementations based on bbolt, SQLite and PostgreSQL (all are available as contrib extensions).
Observability
This is no surprise but the OTel Collector requires some observability on its own, too.
First of all, the collector allows to pass the Resource attributes as key-value data, so you can override the way the collector deployment is represented on your observability platform. Also, you can pass additional attributes associated with the collector that are going to be attached to all observability signals.
Logging
For logging, the collector uses Uber’s zap, a popular high-performance logging library.
Besides common configs like log_level or encoding (e.g. JSON, a human-readable console format), the collector exposes:
- the initial fields config that is useful to label all logs with some metadata like
teamorowner. - log sampling. The sampler tracks log records with the same level and message and can make sure only
Nrecords are logged in a period of time. After that, it will either drop all remaining records in that time window or log one inMrecords. This is a great way to keep representative logs while managing the general log volume. As a result, sampling helps to relax CPU and I/O load as well as reduce the cost of storing generated log data.
Metrics
Just like with logging, the collector offers three levels of metrics collection:
none- no metrics will be collected.basic- the recommended option that covers the basics of collector functioning.detailed- besides doing metric measurements, it also logs OTel structures for debugging purposes.
There is a separate feature gate that filters out metric attributes that can potentially cause the high cardinality problem. The filtering is done via metric views that help to configure aggregations around metric measurements and, what is crucial for our case, it can drop some data points along the way. Specifically, the collector drops attributes in its gRPC and HTTP API instrumentations:
- Hostname and port number
- Local socket address and port number
Now let’s take a deeper look at the collector’s conventions around metrics and what it’s actually trying to measure.
All dynamic pipeline components have some well-defined metrics to measure on top of metrics custom components may decide to record additionally under the hood.
Pre-defined metrics are scoped with component prefixes like receiver/, scraper/, processor/, and exporter/.
If some operations like span export can end up with success or different failures, the OTel collector measures them as distinct metrics. For example:
exporter/sent_spans- a counter that tracks spans exported successfullyexporter/send_failed_spans- a counter that tracks failed to be sent by exporterexporter/enqueue_failed_spans- a counter that tracks failures related to queuing spans e.g. the queue is full
Such separation helps to plot this data and attach some state-specific context as attributes.
All three sets of metrics contain component ID (like exporter ID) information in attributes.
Other than that, the collector measures in-process stats periodically (not more frequently than once per second):
process_uptime(in seconds)process_runtime_heap_alloc_bytes- memory occupied by referenced and unreferenced (not yet swept) heap objectsprocess_runtime_total_alloc_bytes- cumulative (only increases and doesn’t decrease after garbage collection) version of the metric aboveprocess_runtime_total_sys_memory_bytes- virtual memory allocated by Go runtime (from the OS perspective)process_cpu_seconds- total CPU time (userandsystemcombined)process_memory_rss- total physical memory allocated (RSS)
Tracing
The tracing part of the collector looks very standard. The collector exposes span processor and context propagator (Trace Context and Zipkin’s B3 supported) configs. Those span processors are components from OTel Golang SDK and have nothing to do with the collector’s data processing pipelines (The OTel Collector, basically, acts as any other service instrumented with OpenTelemetry SDK).
Not absolutely every workflow is covered by traces. Only receiving and exporting parts of data pipelines and rather on the high level (of course, custom components can do their own tracing).
In receiver context, there may be long-lived contexts associated with gRPC streams, for example, so they outlive several data ingestions that come via that stream.
In such cases, the collector doesn’t use that context to start a new trace (to be able to end it correctly later), but rather:
- uses
context.Background()to create a new root span on it. If the long-lived context has any span context, it will be linked with the newly created span. - puts the new span into the copy of the long-lived context and returns that.
Extensions
Extensions expand the collector’s functionality that doesn’t work directly with signal data. A great example of that would be authentication. There are many authorization methods in use out there and it would be impossible to account for every single case out of the box. However, with extensions, we keep the door open for new authentication mechanisms.
This is how extensions configuration looks:
# ...
extensions:
  health_check:
  pprof:
    endpoint: :1888
  zpages:
    endpoint: :55679

service:
  extensions: [pprof, zpages, health_check]
  pipelines:
    # ...
# ...
extensions:
health_check:
pprof:
endpoint: :1888
zpages:
endpoint: :55679
service:
extensions: [pprof, zpages, health_check]
pipelines:
# ...Technically, extensions are a special case of the collector’s components. They are plugged into predefined points of OTel workflows by implementing one or more interfaces:
PipelineWatcherindicates if data can be ingested yet or not (useful for health checkers).ConfigWatcherindicates changes in the OTel collector configuration.StatusWatchermarks an extension as a component status listener.auth.Server&auth.Clientsignal that an extension can authenticate incoming client requests for receivers or outgoing requests for exporters correspondingly.
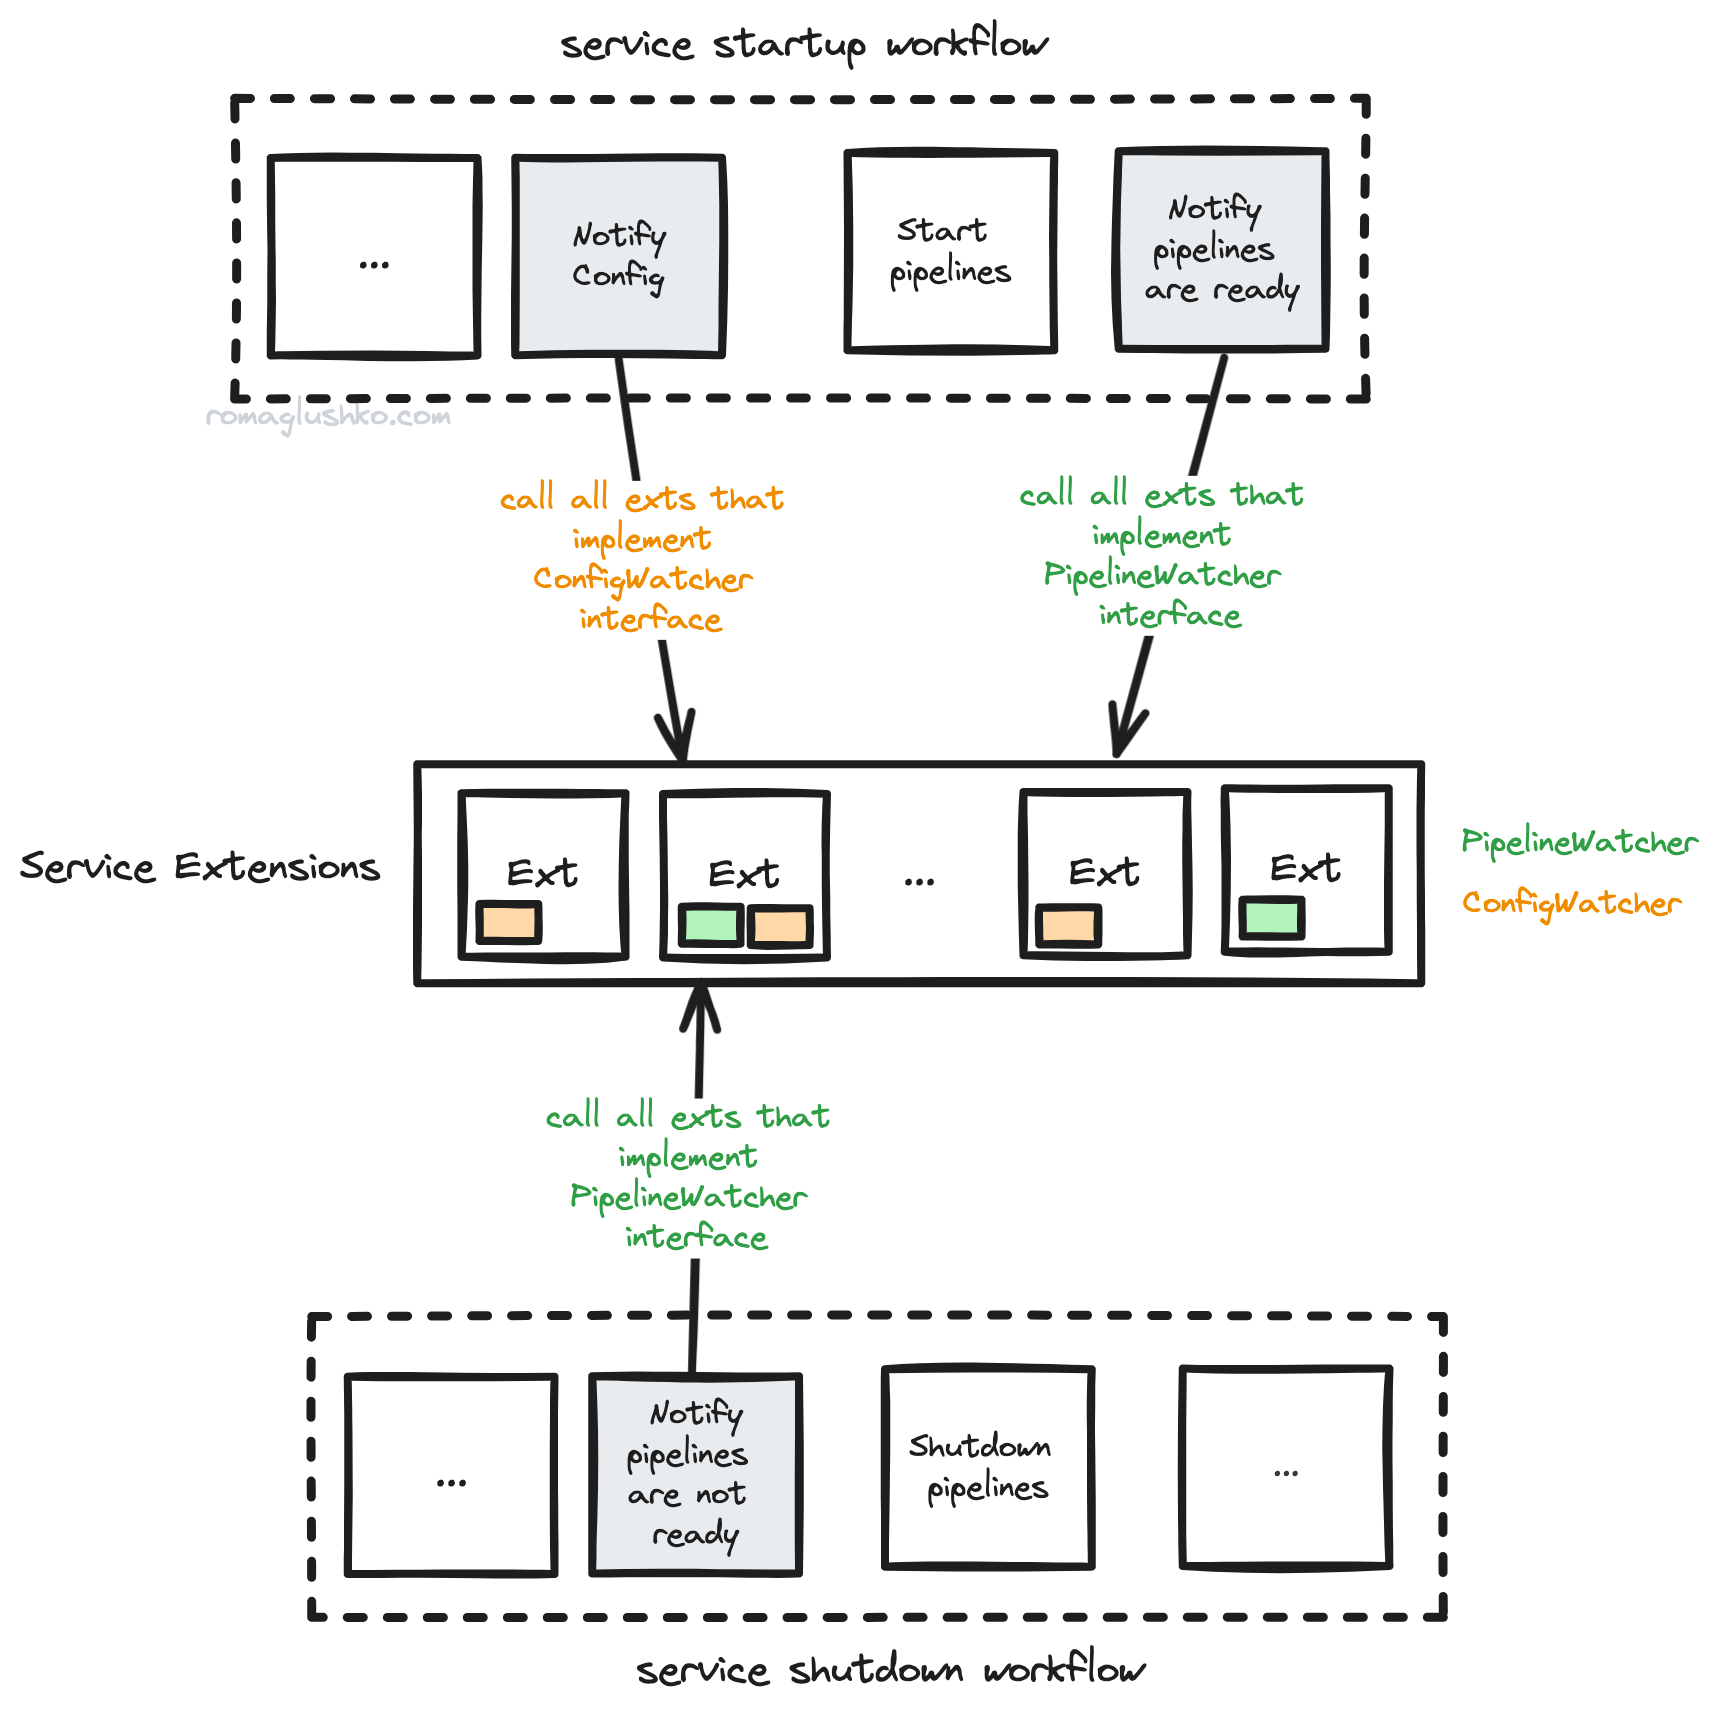
Extensions may depend on other extensions, so the collector builds another DAG to get the startup/shutdown order of all of them.
Authentication
OTel has two potential places where authentication is important:
- on the receiver’s side when it accepts new observability signals
- on the exporter’s side, when it tries to offload collected signals for persisting
Both cases are covered via extensions. The OTel Collector defines two separate extension interfaces to provide a token-based authentication.
Receivers implement authentication as a net/http middleware. It passes an incoming HTTP request headers (or gRPC metadata) to the authentication extension to do token validation. Another important middleware collects client information from the incoming request as an additional metadata or context (e.g. tenantID) for the following usage on the processing stage. HTTP receivers pull HTTP headers as metadata while gRPC receivers use the corresponding RPC metadata.

Client authentication is based around overriding http.Client’s RoundTripper (RoundTrippers should not modify requests, so the collector has to copy the original request to pass authN data to the copy and send it further) or gRPC’s PerRPCCredentials.
As contrib extensions, the OTel Collector supports Basic, Static Bearer Token, OAuth2 Client Credentials, OIDC, and a few vendored authentications like ASAP.
The OTel Collector also supports mTLS authentication, but it’s done via the collector’s TLS configuration for servers and clients.
ZPages
ZPages is a way to peek into the internal state of the OTel Collector via a set of handy HTML pages. You can check out things like:
- trace data (e.g.
/debug/tracez) - pipelines configuration (e.g.
/debug/pipelinez) - feature gates (e.g.
/debug/featurez) - Collector built-in service information (e.g.
/debug/servicez) - extensions (e.g.
/debug/extensionz)
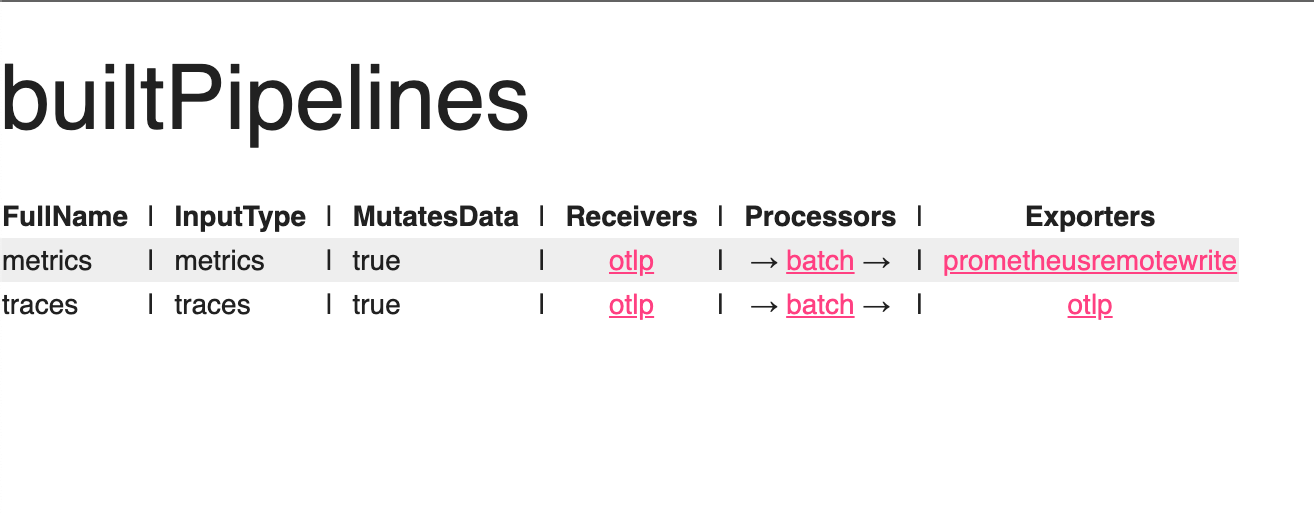
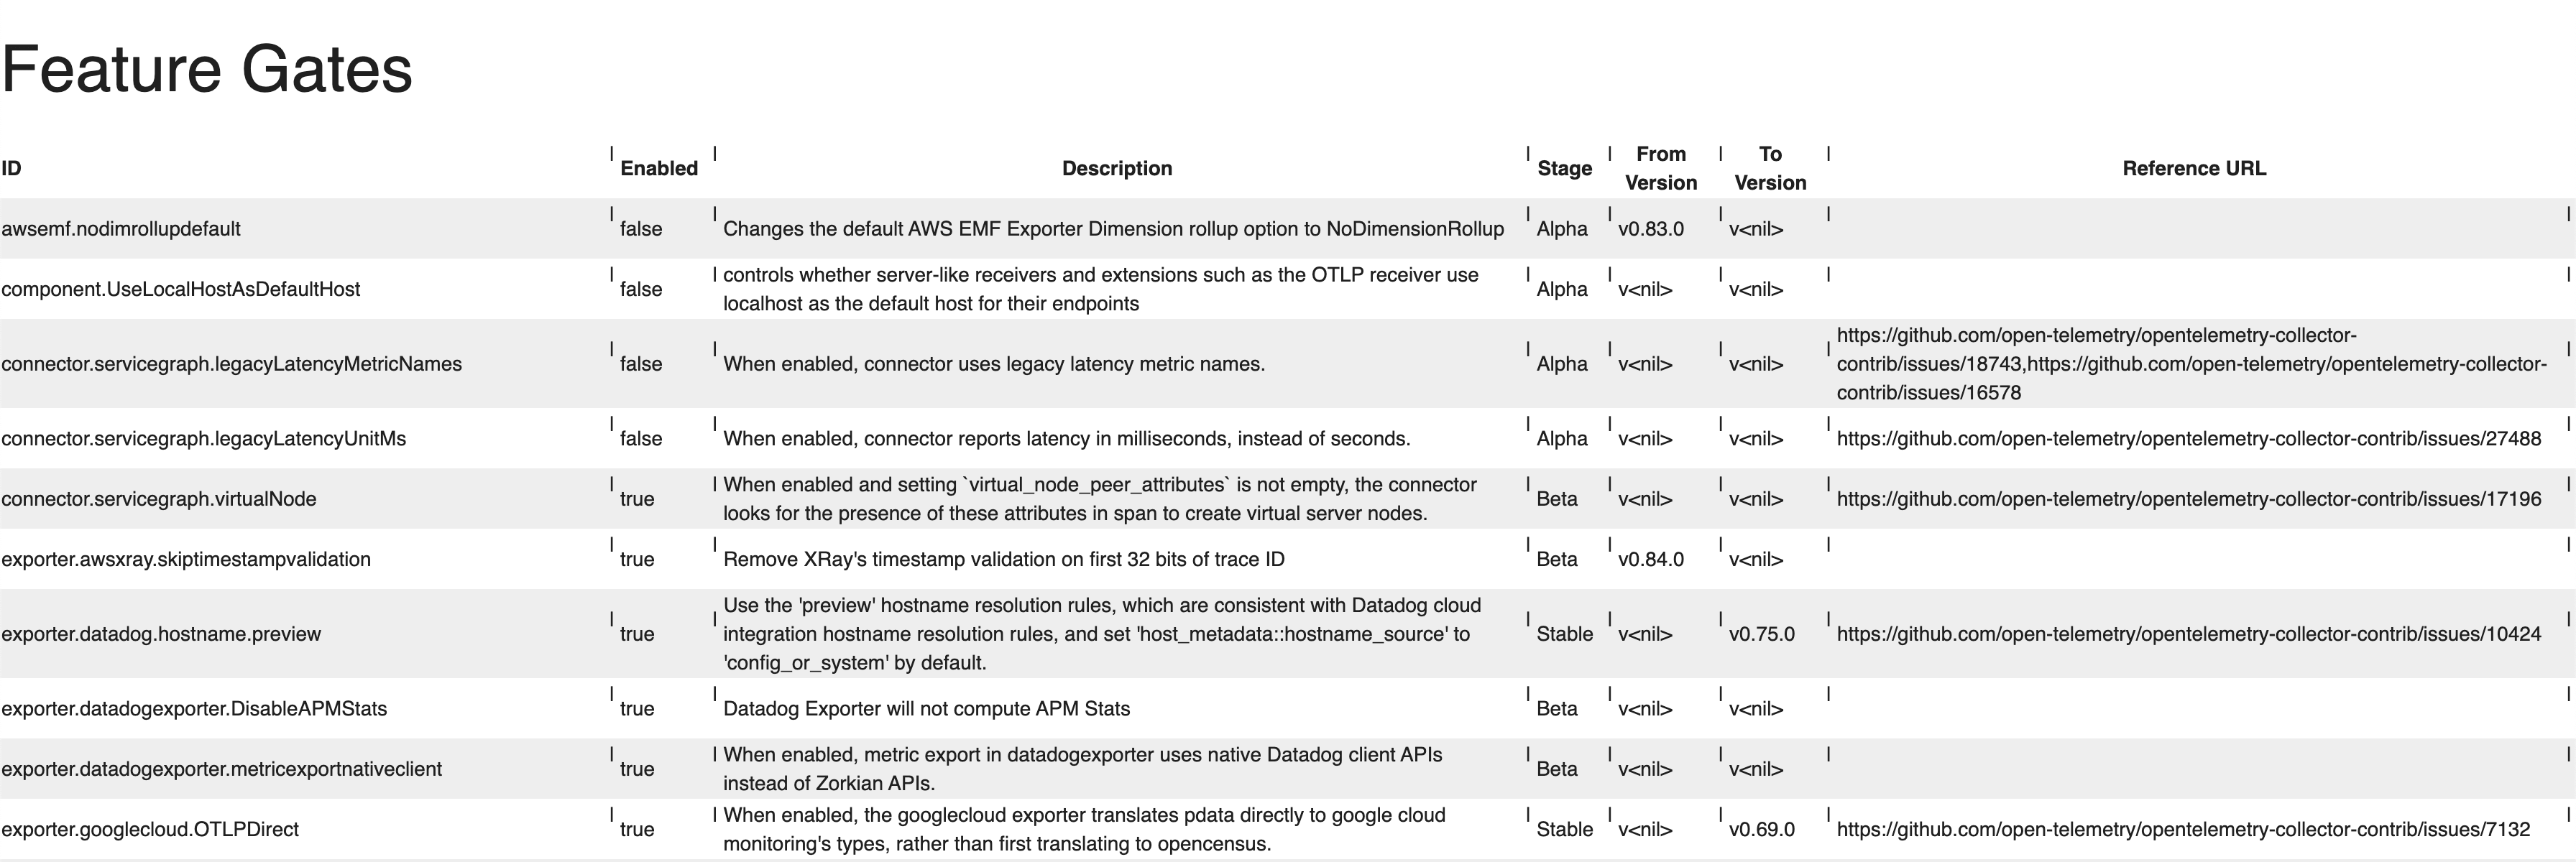
ZPages works as an extension that expects the RegisterZPages() method to be implemented.
The method is given with a http.ServeMux and other components can register their pages.
As an extension, Zpages offers a set of methods to render various simple UI primitives in a consistent style.
Custom Collectors
The OpenTelemetry Collector offers a lot of flexibility. You can extend it, install new receivers, processors, exporters, and extensions. But how exactly does that process work?
The collector is written in Golang and compiled into a single binary. This is great for performance, but not as easy to extend as a Python application, where you can install addons at runtime.
Indeed, to extend the OTel Collector, you need to build your own custom collector instance. However, OpenTelemetry tries to simplify that process with a separate CLI called the OTel Collector Builder (aka OCB).
OCB is a typical code generator. It takes a config that defines the Collector’s meta information and lists of receivers, processors, exporters, extensions as regular Go modules to install and plug in:
dist:
  name: custom-collector
  description: Custom OpenTelemetry Collector
  output_path: ./dist

exporters:
  - gomod: github.com/open-telemetry/opentelemetry-collector-contrib/exporter/alibabacloudlogserviceexporter v0.86.0
  - gomod: go.opentelemetry.io/collector/exporter/debugexporter v0.86.0

receivers:
  - gomod: go.opentelemetry.io/collector/receiver/otlpreceiver v0.86.0

processors:
- gomod: go.opentelemetry.io/collector/processor/batchprocessor v0.86.0dist:
name: custom-collector
description: Custom OpenTelemetry Collector
output_path: ./dist
exporters:
- gomod: github.com/open-telemetry/opentelemetry-collector-contrib/exporter/alibabacloudlogserviceexporter v0.86.0
- gomod: go.opentelemetry.io/collector/exporter/debugexporter v0.86.0
receivers:
- gomod: go.opentelemetry.io/collector/receiver/otlpreceiver v0.86.0
processors:
- gomod: go.opentelemetry.io/collector/processor/batchprocessor v0.86.0Using the config, it generates several files by rendering templates:
go.modfile that includes all component modules to download and a set of the OTel collector core modules likego.opentelemetry.io/collector/otelcol.components.gofile that registers all component factories to inform the collector that they existmain.gothat tie together them all and calls the collector’s CLI- a few more files including tests that check an effective collector’s config structure after registering all components
Finally, Builder compiles generated boilerplate by running go build with various flags and build tags via exec.Command().
Feature Gates
The OpenTelemetry Collector has a feature gate system to guard functionality that is being developed from impacting real users.
Each feature gate may go through these stages:
Alpha(a.k.a Private Preview) when the gate is disabled by default, but can be enabled on demand.Beta(a.k.a. Public Preview) when the gate is enabled by default, but can be disabled on demand.Stable(a.k.a. Generally Available or simply GA) when the gate is permanently enabled.Deprecatedwhen a feature was not fully proven to be useful and it’s on its way to be removed.
Deprecated features stay there for two releases before being fully removed.
OTel has left an opportunity to deprecate or call back stable features, too. In that case, they move into the alpha stage for two releases and then get deprecated for two releases before being removed.
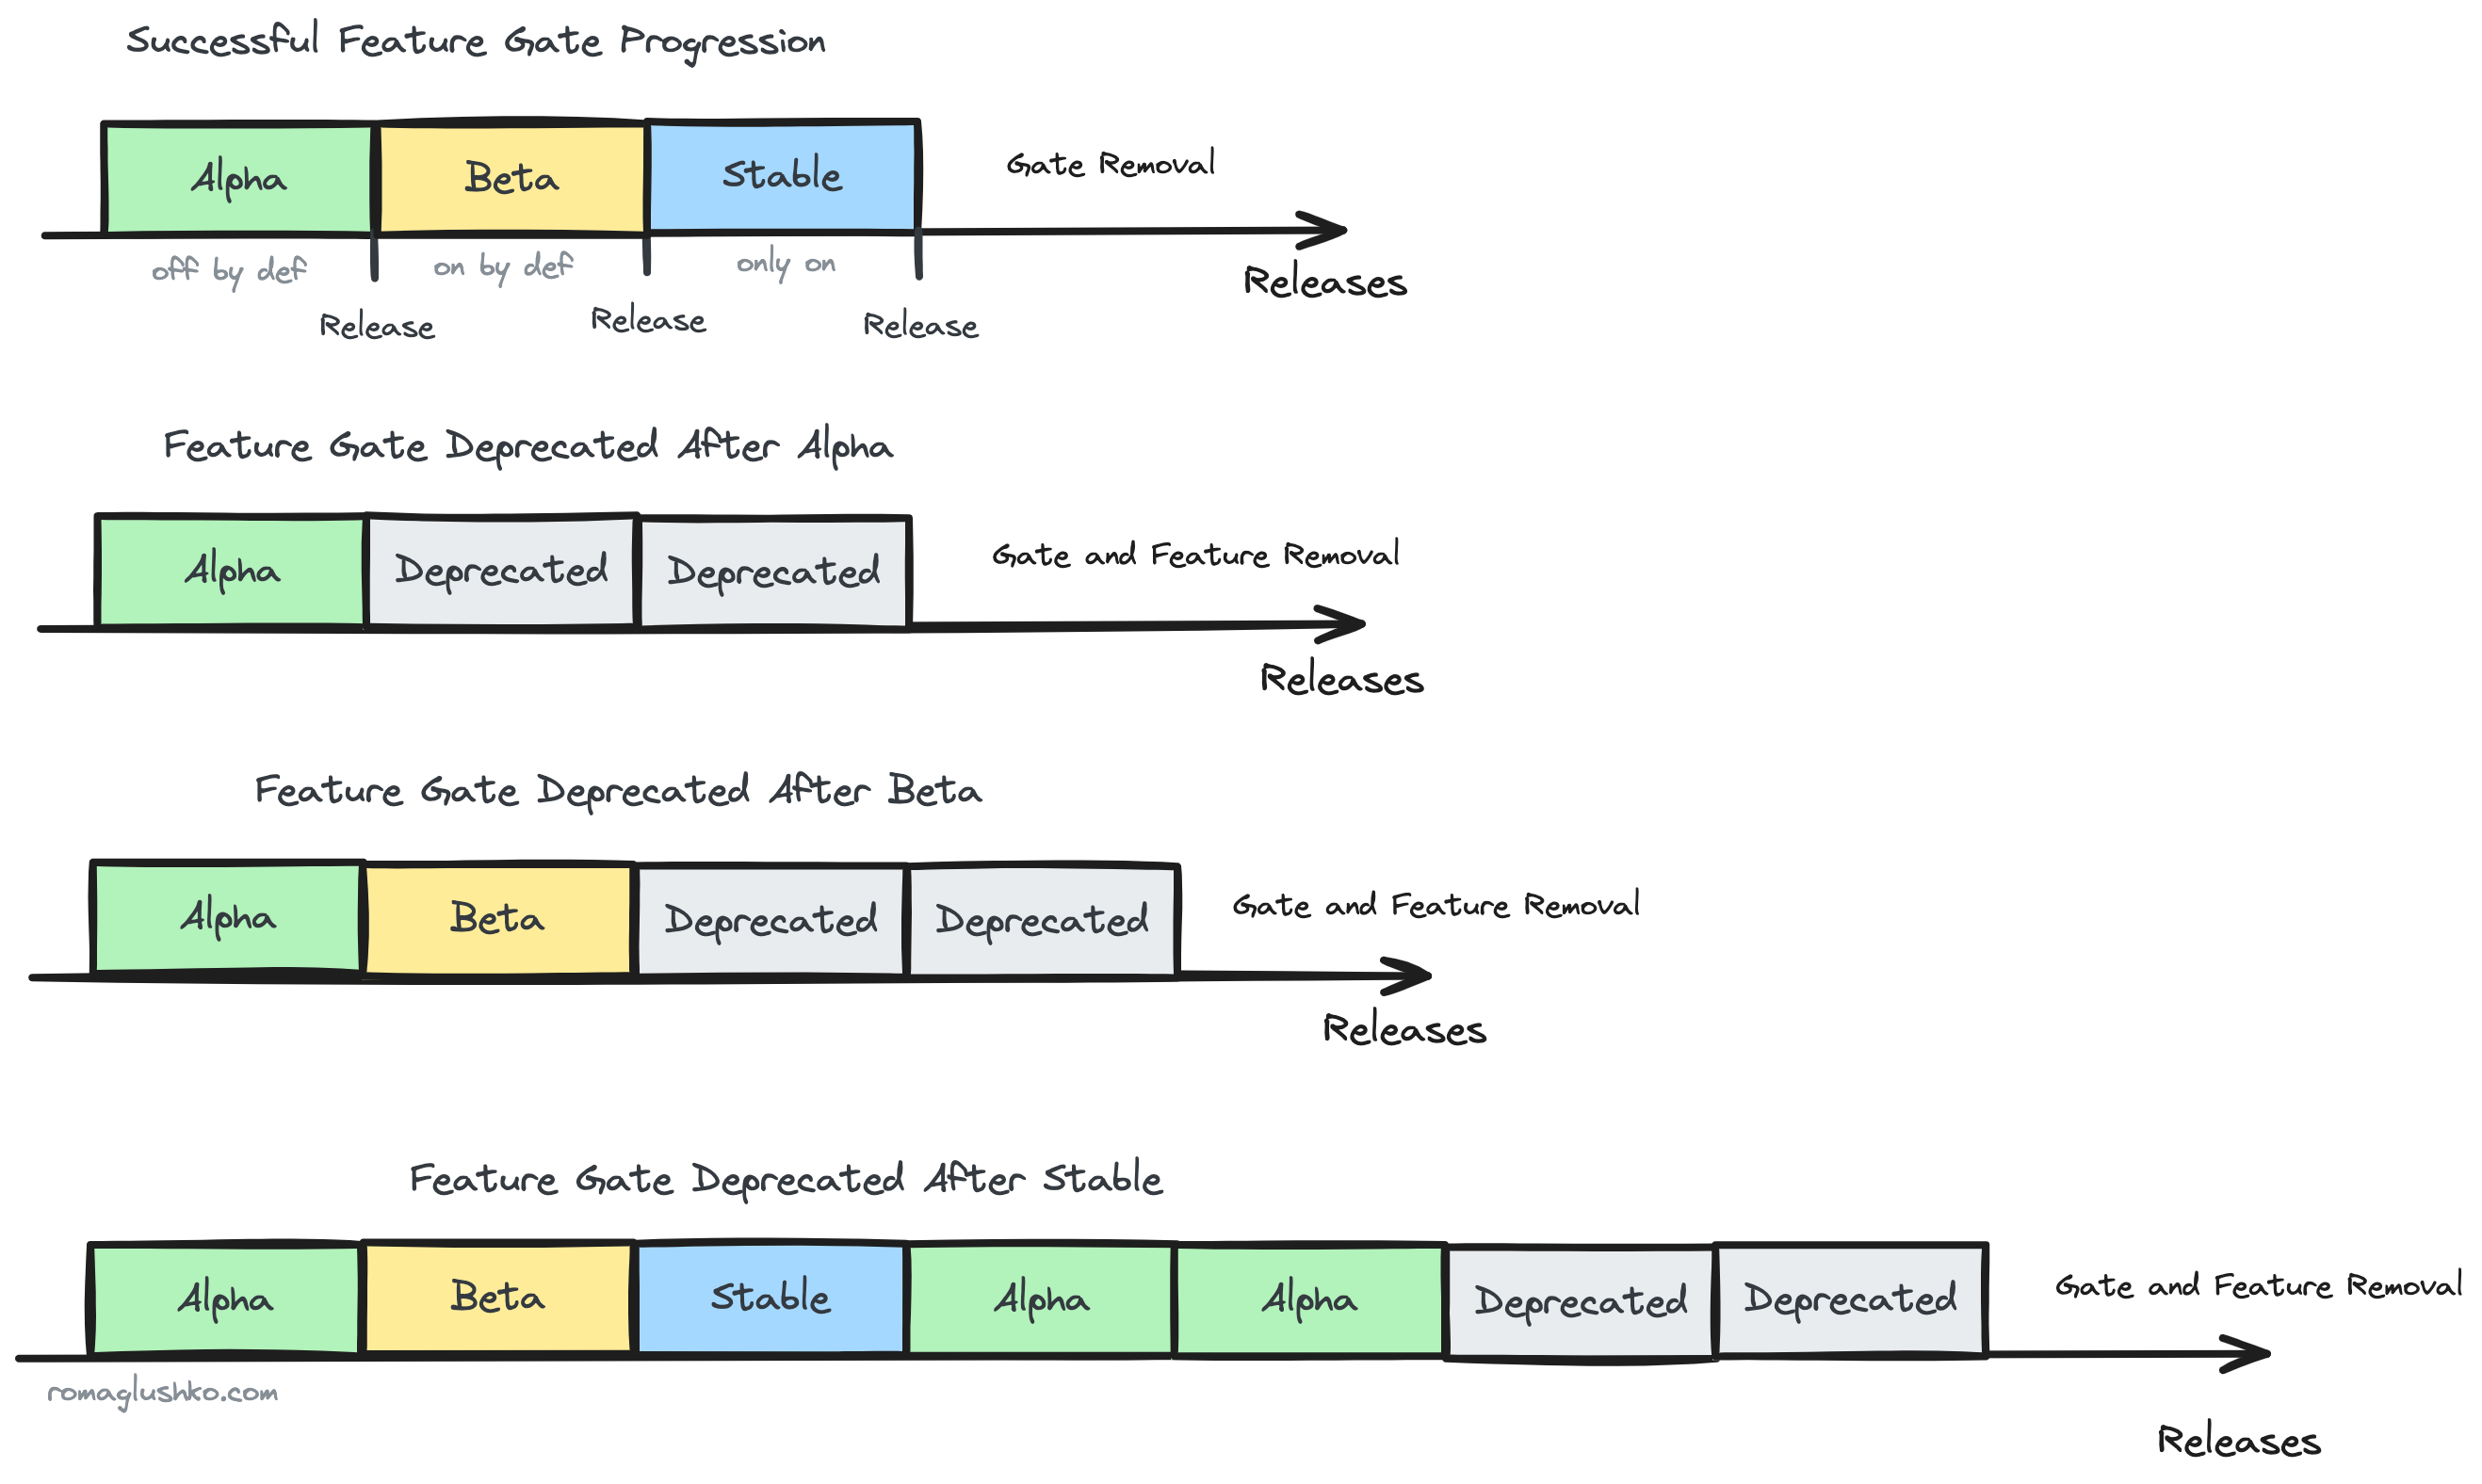
Once the flag is deprecated and about to be removed, the removal itself is done manually via pull request.
In code, the feature gate functionality is represented as a feature gate registry where gates are registered on the global scope (and then checked somewhere in the codebase):

Users are in control of enabled gates by passing a special CLI flag.
What’s next?
We have already gone over the design of OTel SDK and explored the internals of the collector in this article. But guess what? We still have not yet fully covered OpenTelemetry tooling.
One more topic that I would love to dive into in this series is the OpenTelemetry Kubernetes Operator and how it helps to deploy and scale the OTel Collector. But hey, let’s save that topic for another time.
If you’re enjoying this OpenTelemetry series, please share it on social media 🙌
